
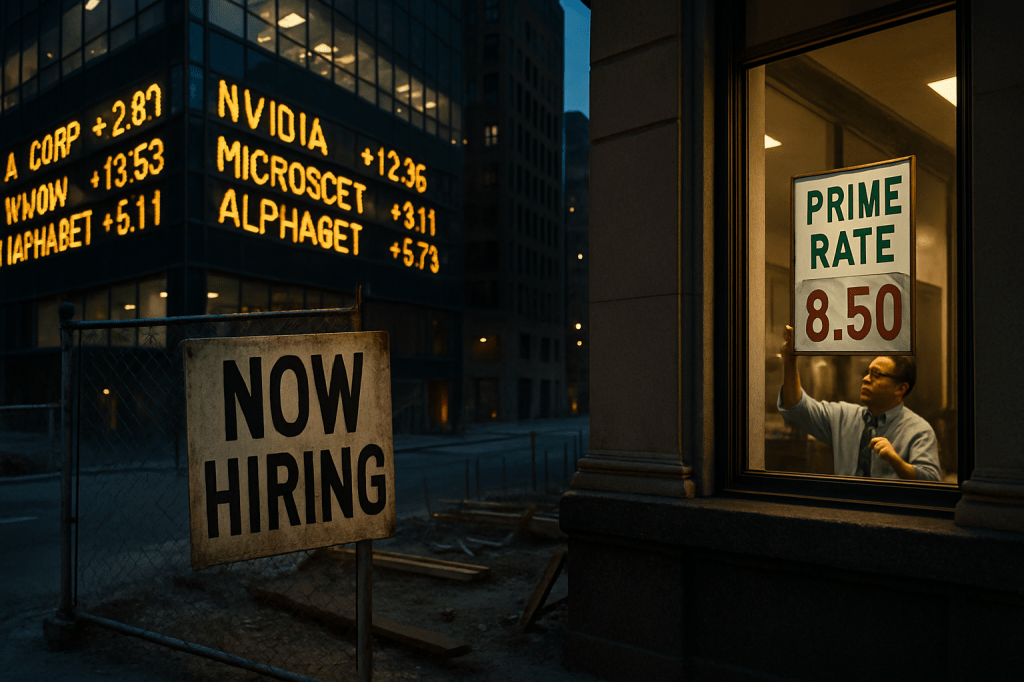
When the “Scariest Chart” Met the Fed
The chart that launched a thousand think pieces finally escaped the timeline and walked into the mainstream. On November 1, financial outlets translated a viral image into a broader argument about power: a stock market stacked on AI upside versus a labor market falling out of love with hiring. A 70–75% surge in the S&P 500 since ChatGPT’s debut sits beside a roughly 30–33% plunge in U.S. job openings. It looks like a morality play where automation wins and workers lose. But the new coverage did something rare in a hype cycle—it traced the timing, and the timing refused to cooperate with a simple story.
Job openings topped out around 11.5 million in March 2022. That month, the Federal Reserve began raising interest rates. By late summer 2025, openings had slid to about 7.2 million. The stock index, meanwhile, marched from roughly 3,840 toward 6,700 after November 2022, when generative AI became dinner‑table conversation. If AI were the main force strangling hiring, you’d expect the labor market’s turn to follow the chatbot moment. Instead, it preceded it. The sharpest knife in the plot belongs to monetary policy, not machine learning.
The chart’s optical illusion
The S&P looks like a referendum on AI because the rally has been led by a small club of AI‑linked giants. Concentration makes a composite index feel like a vote on the technology itself, even when most companies are living in a higher‑rates world with ordinary margins and ordinary borrowing costs. That’s the misdirection: an AI‑powered price boom sitting atop a broad economy digesting the bill for tighter money. The juxtaposition reads as “AI up, jobs down,” but what you’re really seeing is “expectations up, financing conditions down.”
The sector smell test
There’s a more grounded way to interrogate causality: look where the bodies are. If AI were already mowing down openings across the economy, the “Information” sector should be leading the decline. It isn’t. Information has seen the smallest pullback in posted roles. The sectors that buckled most are the ones that wobble when money gets expensive—construction and manufacturing. That’s the fingerprint of interest rates, not a silent automation wave stealing requisitions in the night.
Local tremors, macro weather
None of this absolves AI from reshaping career pressure points. The Nov 1 coverage flagged stress concentrated among younger workers in AI‑exposed roles. That’s consistent with what many of you are seeing on the ground: the entry ramp is narrower, the bar higher, the expectation to co‑pilot with models now implicit. But zoom out and the macro line still points to the Fed. Local quakes do not equal a continental shift—at least not yet.
Policy, not prophecy
Why does the reframing matter? Because if hiring softness is primarily a function of tight money, it is cyclical. As policy eventually loosens, openings should find their way back, independent of any near‑term automation trend. That matters for workers and institutions deciding whether to double down on retraining for AI displacement now, or to prepare for a rate‑driven thaw where soft skills like project coordination and sales rebound alongside new AI‑complementary tasks.
How to read the next twelve months
Treat the chart as a diagnostic, not a destiny. Watch the order of operations: does the Fed signal easing and do interest‑sensitive sectors move first? Does the rally broaden beyond the AI bellwethers, or does market concentration persist while openings turn? Do postings in Information hold up while construction lags, or does the pattern flip? The timing and the sector mix will tell you when AI shifts from narrative driver to macro driver.
The real story yesterday wasn’t a new layoff or a novel dataset. It was a collective gear shift. Editors and analysts finally separated two concurrent realities: an asset market priced on AI’s potential and a labor market governed, for now, by the cost of money. You can hold both truths at once. The machines are advancing. The jobs slump is mostly monetary. And that means the scariest chart isn’t a verdict—it’s a map, and policy is still holding the pen.
